October 21, 2026 · Indumor
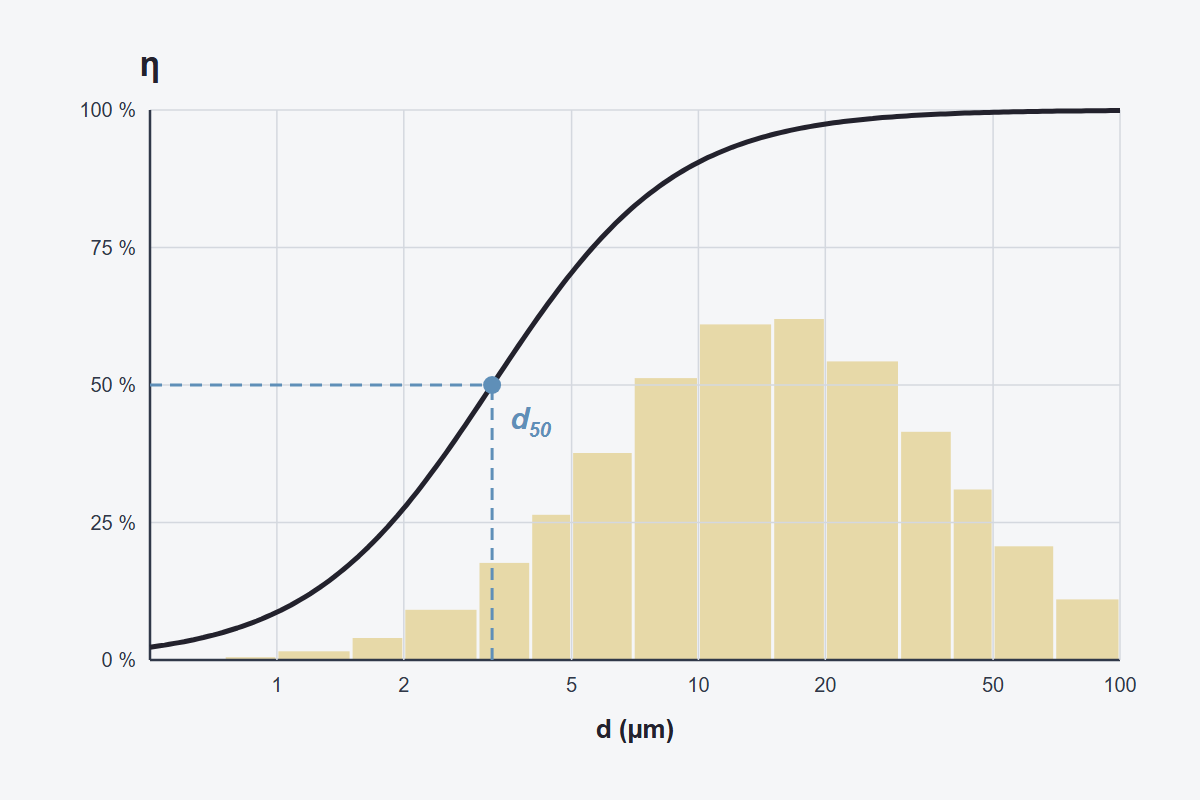
It is a request that keeps coming back: someone asks for a “95% cyclone.” The next question is always the same: 95% of what dust? A cyclone does not have an efficiency; it has a curve. It catches almost everything coarse, half of what measures a certain size and very little of the fine stuff. How much of a given dust it catches depends on how much dust of each size the air carries.
The classic model for estimating it is Lapple's. It starts from the cyclone's dimensions, the inlet velocity, the gas viscosity and the particle density, and gives the cut diameter, d50: the particle size the cyclone captures at 50%. With that number, the efficiency-by-size curve is approximated with a simple formula: η = 1 / (1 + (d50/d)²).
A worked example: a Stairmand high-efficiency cyclone 500 mm (about 20 in.) in diameter, handling 1,620 m³/h (about 950 cfm) with an 18 m/s (3,540 fpm) inlet, separating a dust of 2,500 kg/m³. The model gives a d50 of 3.24 microns. With that cut, the cyclone catches about 9% of 1-micron particles, 28% of 2-micron, 70% of 5-micron, 90% of 10-micron and 97% of 20-micron particles.
In the chart above, the curve is this example's efficiency and the bars are the size distribution of a dust with a 15-micron mass median diameter.
What moves d50 can be read straight off the model's formula: the cut gets finer with a higher inlet velocity, more turns inside the cyclone or denser particles, and coarser with a wider inlet or a more viscous gas. That is why a smaller cyclone at the same inlet velocity cuts finer, and the same cyclone handling hot gas cuts coarser: air viscosity rises with temperature.
Overall efficiency comes from adding up, band by band, the fraction of dust in each size times the efficiency at that size. With a dust of 15 microns mass median diameter and a typical spread (geometric standard deviation of 2.5), the math goes like this:
Adding the contributions, the cyclone catches about 88% of the dust; integrating in finer detail, 88.7%. Now take the same cyclone, with the same air, facing a finer dust of 5 microns mass median diameter. The curve did not change, but the dust did: overall efficiency drops to 63.6%. Neither reaches the 95% that was asked for, and the difference between them is not the cyclone: it is the particle-size distribution.
That is why the ranges the US EPA gives for high-efficiency cyclones are so wide: 80 to 99% of total particulate, 60 to 95% of what is under 10 microns and 20 to 70% of what is under 2.5. They depend on the dust as much as on the equipment.
The first step is a laboratory particle-size analysis of a sample of the real dust, along with the particle density, which is not the bulk density of the piled dust. With that, efficiency is calculated band by band, as above, and you know in advance how much will go on to the filter or out the stack.
The second step is to take the result for what it is: an estimate. Lapple's model assumes spherical particles moving in the Stokes regime, does not correct for slip on the finest ones and ignores dust loading; with heavy loading, real efficiency is usually higher. A study that compared published models with measured cyclones found none that predicted the real cut points well. If an emission limit has to be guaranteed, a baghouse goes after the cyclone.
Nor is it wise to chase efficiency with velocity alone. Below about 12 m/s (2,400 fpm) a cyclone separates poorly, but above about 25 m/s (4,900 fpm) it starts to wear and to pick up again what it had already separated, and pressure drop grows with the square of velocity: going from 18 to 22 m/s raises it by almost half. The design that cuts finest is rarely the one that costs least to run.
The Engineering Suite's cyclone calculator (in Spanish) does this math with your particle-size distribution: it gives d50, the band table and the overall efficiency. Its “Simular flujo” button shows the same model in motion: every point is the same mass of dust, and its fate — dropping down the cone or leaving through the central tube — is decided by the efficiency curve, so the share that escapes on screen matches the calculation. It is an animation of the model, not a fluid-dynamics simulation.
If the cyclone will work as a pre-cleaner, the “Cyclone or baghouse” guide below explains how the two share the work. At Indumor we build custom cyclone separators; send us your dust's particle-size analysis and we will run the numbers together.
Send us the particle-size analysis and the particle density, and we will work it out with you.
© Indumor 2010–2026 — Industrial steel fabrication, Córdoba, Argentina
